Standalone Altium 365 Gerber Compare
Parent page: Altium 365 Viewers
The standalone Altium 365 Gerber Comparison viewer provides free access to graphically view the differences between Gerber fabrication files through your web browser. This offers a quick and easy solution for checking a design's fabrication output between release iterations or prior to sending your board production data out to manufacture.
As a free service developed and provided by Altium, the Gerber Compare viewer delivers its full functionality without the need for downloads, software installations, or registration. A wide range of common Gerber file packages is supported, including Gerber output files generated by Altium Designer and other ECAD applications, or even Gerber data provided by hardware vendors.
► Access the online Gerber Compare tool at https://www.altium.com/gerber-compare or from the ![]() button in the Altium 365 Standalone Web Viewer.
button in the Altium 365 Standalone Web Viewer.
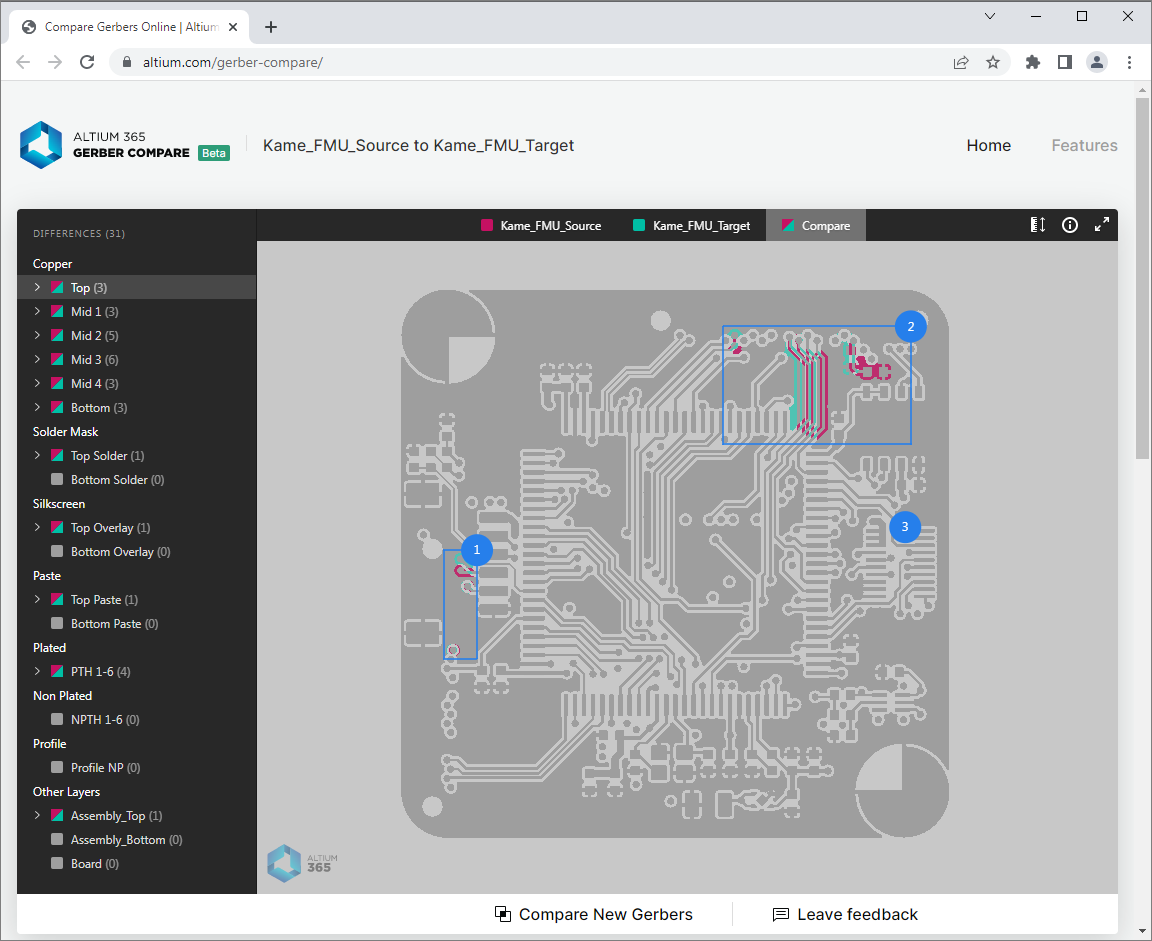 You can upload two Gerber datasets to analyze the visual and data differences between the two.
Compare Gerbers
The online Gerber Compare viewer accepts standard RS-274X or X2 -formatted Gerber data in an archive file (ZIP, RAR, etc) or as specified files from a local folder. Drag and drop the archived Gerber sets onto the interface boxes (newer and older versions), or use the ![]() option to browse and locate suitable sets of Gerber files or single Gerber archives – you also can drag and drop folders into the upload boxes. The viewer's compare engine will calculate the differences between the newer/older (source/target) Geber sets as soon as they have been uploaded. Note that this process may take some time with large or complex designs.
option to browse and locate suitable sets of Gerber files or single Gerber archives – you also can drag and drop folders into the upload boxes. The viewer's compare engine will calculate the differences between the newer/older (source/target) Geber sets as soon as they have been uploaded. Note that this process may take some time with large or complex designs.
Alternatively, you can explore the example Gerber comparison invoked from the View Example Comparison option available below the upload boxes.
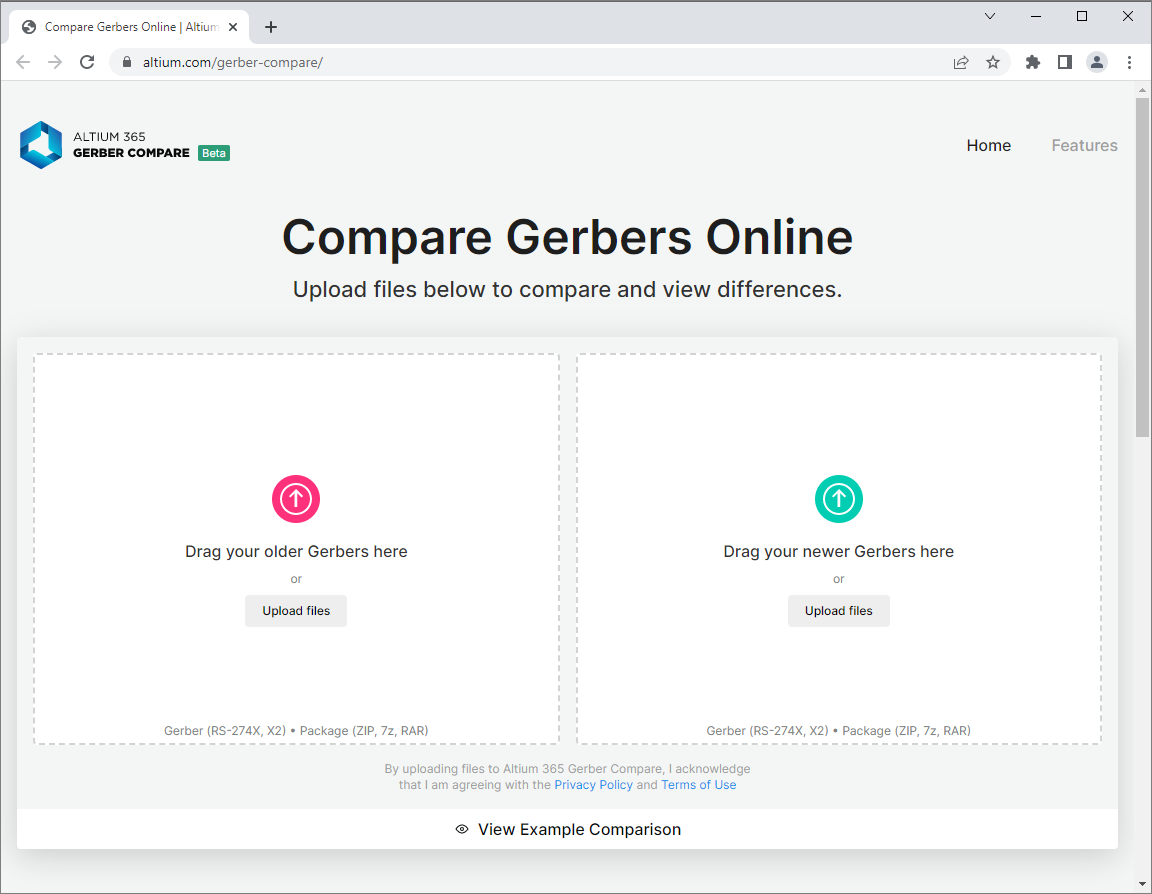 Accessing the online Altium 365 Gerber Compare tool on the main Altium website.
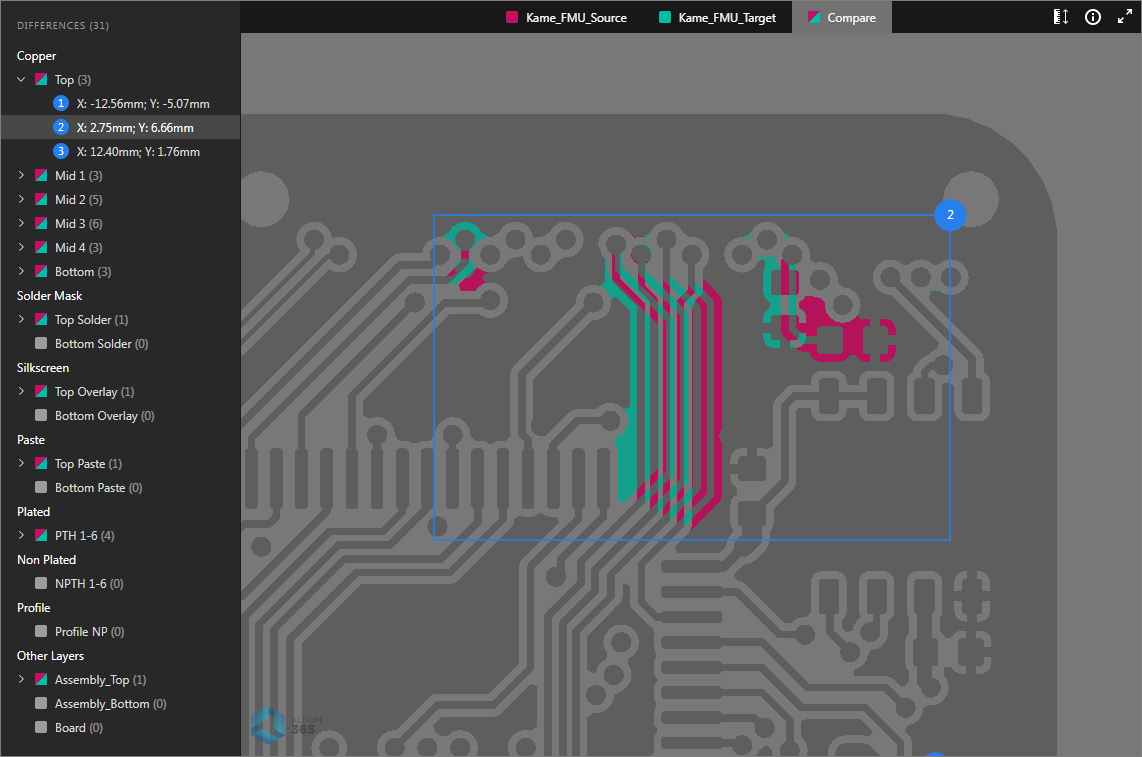
Once the two sets of Gerber files have been uploaded to the Gerber comparison tool, the browser interface presents both the graphical and Net data differences between the Gerber data sets. The interactive UI allows you to individually select and highlight the layout differences on a layer basis, zoom and pan to any board area, and also view each of the source Gerber datasets individually.
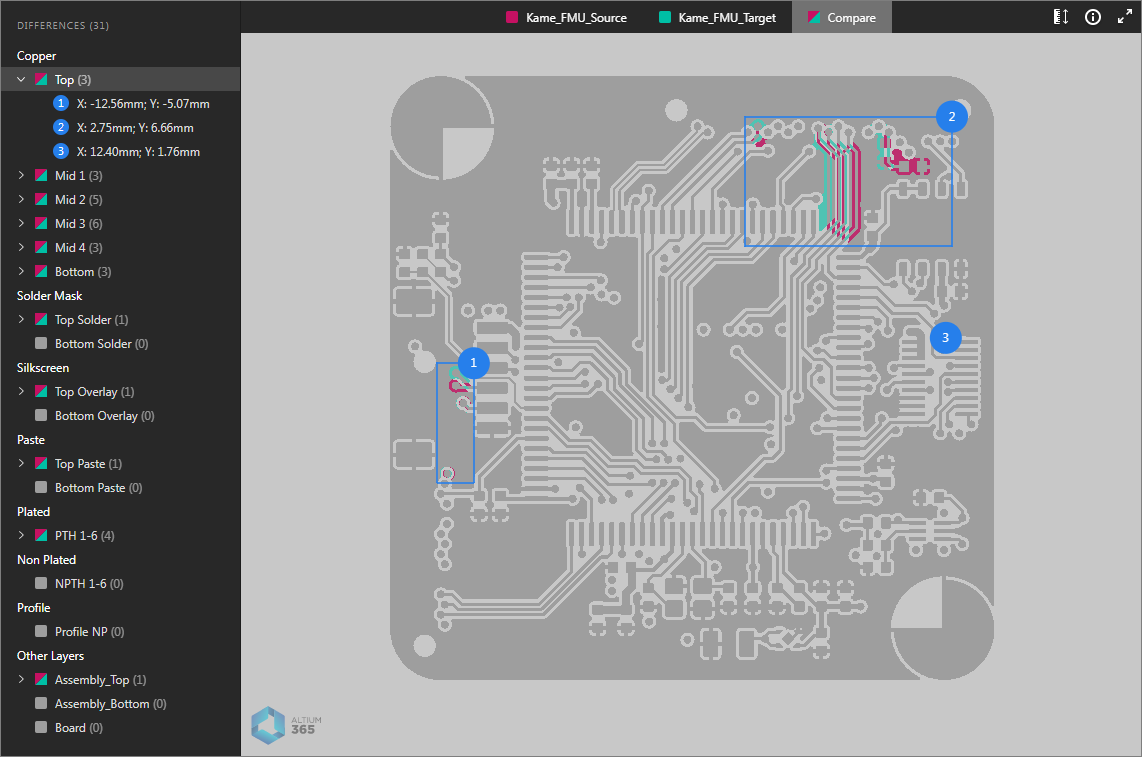 The Gerber Compare view's differencing engine will process each comparative Gerber layer file to create a composite display of the changes between each set.
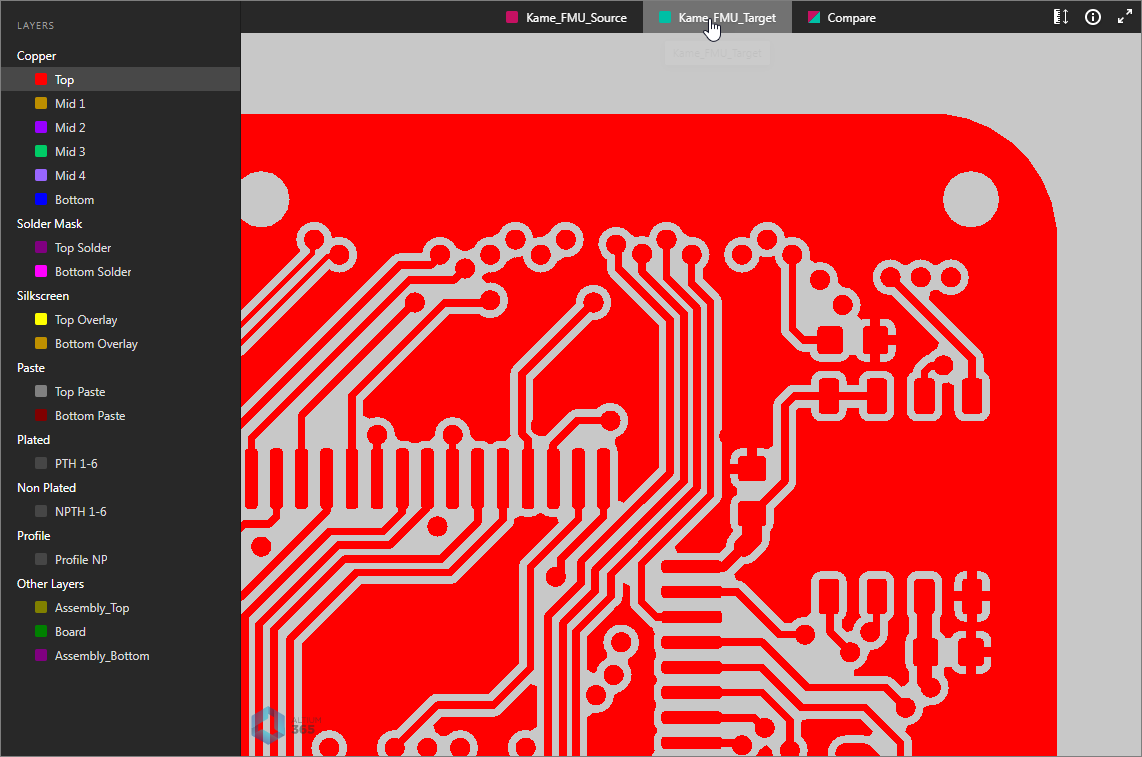
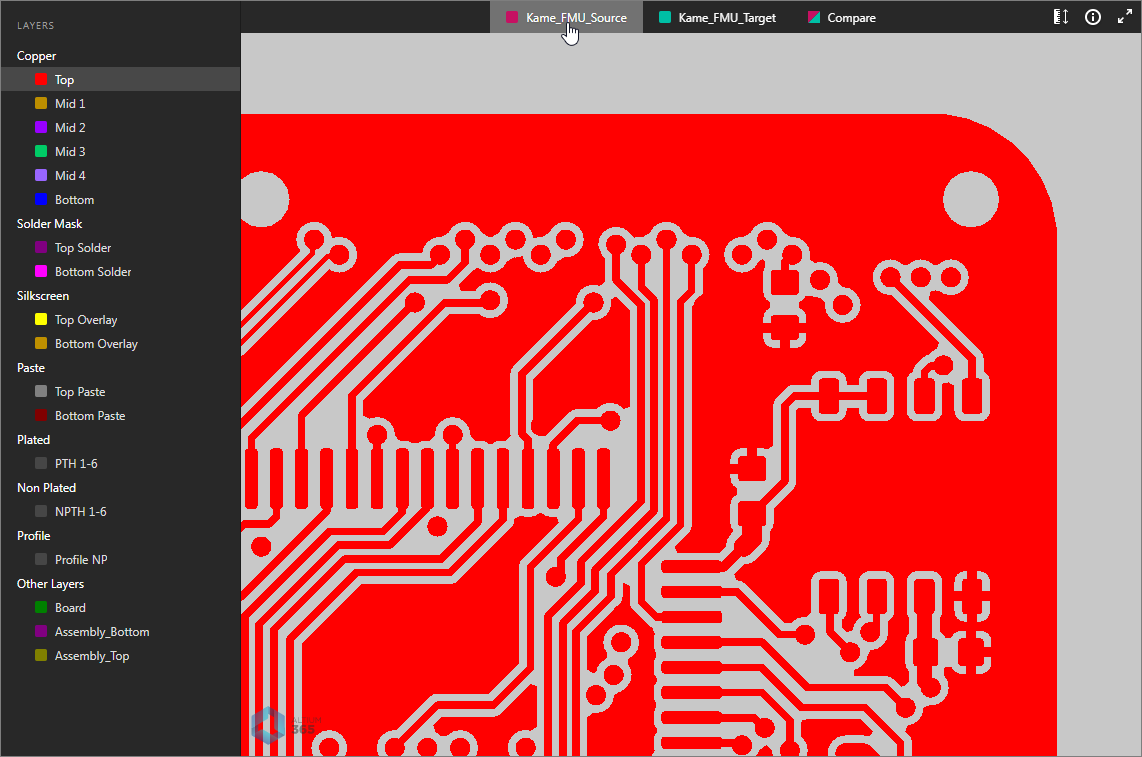
A selected layer can be expanded to show individually numbered net sections that represent the differences on that layer (as shown by default). Click a net entry to zoom in on the change details, where the graphics display is color coded to distinguish the older Gerber data (Red) from the new Gerber data (Green). To view the equivalent Gerber data of the source older/newer sets select their named tabs at the top of the view.
Differences Pane
The Gerber comparison view's Differences pane on the left provides layer and layer differences information, and navigation through those Gerber differences. Entries are included for all board layers, where each layer includes numbered sub-entries for the detected set of differences between the Gerber layer files.
Each difference entry includes location data – indicating the bottom left corner of the entry's blue bounding box – and will cross-probe to its graphical equivalent in the board viewing area. This cross-probing is bi-directional, so selecting a number marker in the board view will highlight its entry in the Differences pane.
You can directly change the view between the older and newer Gerber views while analyzing the changes in the Compare view.
Taking Measurements
You can perform dimensional measurements between any precise two points within the source, target, or Compare Gerber views. To do so click the ![]() button to enter the measurement mode in the Measurements pane.
button to enter the measurement mode in the Measurements pane.
To perform a measurement between two points:
- Click on the first measurement point (Point 1) – this is then marked with a small white cross.
- Move and click on the second measurement point (Point 2). You can right-click (or press
Esc) before defining the second point to start again. - The measured XY distance is reported in the board view and in the Measurements pane. The pane also includes the separate X and Y distances, and the XY location of Point 1 and Point 2.
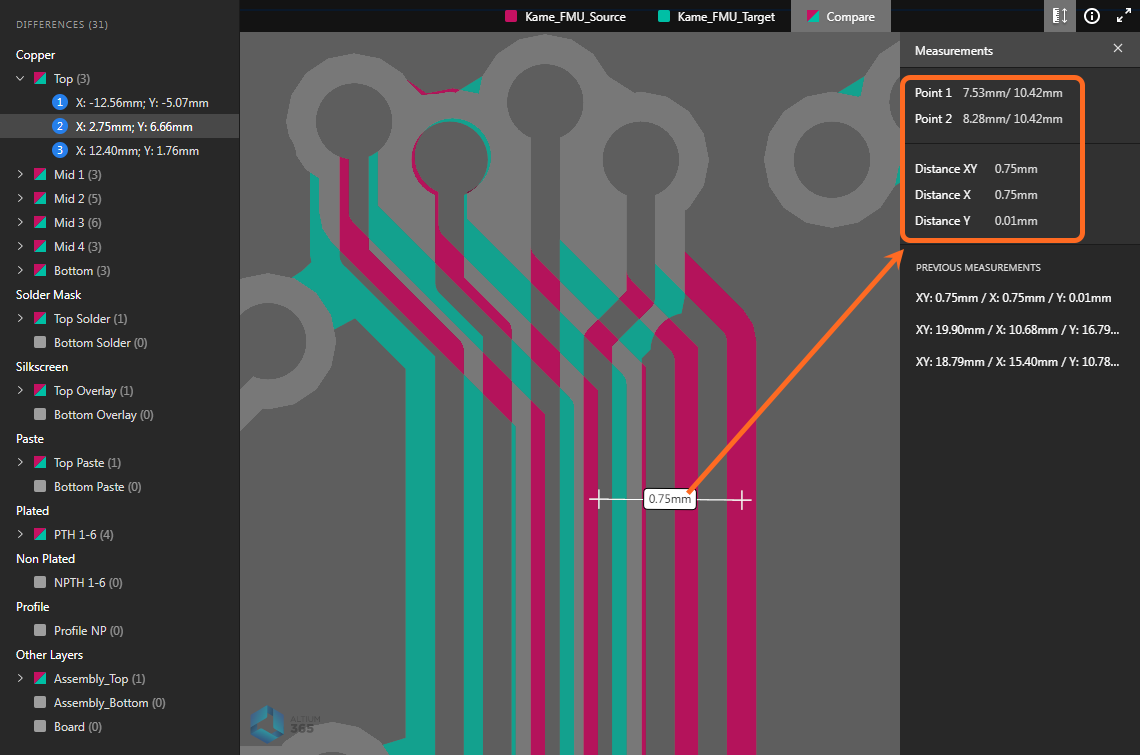 An example of measurements taken on the Compare view and the resulting data in the Measurements pane.
